The NIH did some computer modelling to show that Linus Pauling was wrong. They failed.
Most people are familiar with a computer model. It is supposed to represent reality with some degree of accuracy. For example, the UK Met Office uses models to forecast the weather. People such as fishermen and farmers need accurate information. For fishermen, it can be a matter of life or death. Famously back in 1987, weatherman Michael Fish denied on national TV that there was a “hurricane” on the way. However, the Met Office supercomputer models had failed. We now remember the devastation as the great storm; about 15 million trees were lost, it cost millions, and 18 people died.
Almost anyone can build a computer model. It’s easy as long as its predictions don’t need to be accurate. The first criterion is that it is valid. It represents the thing that it models. Computer engineers and scientists usually compare the output with reality and estimate the errors—the smaller the error, the better the model.
Let’s take a look at the NIH computer modelling of vitamin C. You can find the paper of interest here. Although computer scientists will not find the model impressive, readers can find it here.
The NIH Data
The NIH summarised their pharmacokinetic data in a graph which I reproduce below. Notice they inserted a second graph into the main chart. The inserted graph is not directly pertinent but makes the figure appear even more busy and complicated.
As in their original paper, they superimpose oral and IV doses. They present it as a jumble where it is difficult to see what is happening. But OK, if they didn’t want to give a clear message or were too lazy to clarify for the less attentive reader, that’s their choice.
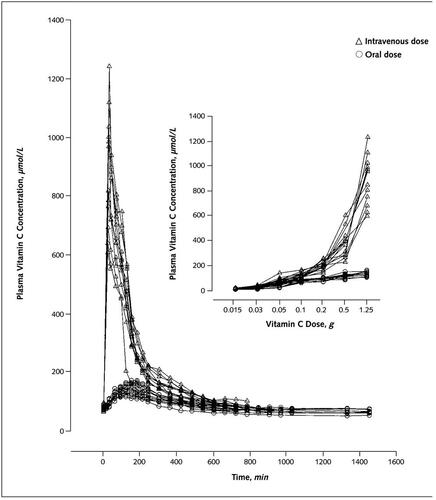
Complicated diagrams of blood levels and dose – actual data
The NIH Simulation
Then we are presented with the output of the NIH model, shown below. Once again, we have two graphs in a single figure. They also put both oral and IV doses together. Similarly, they include data from multiple intakes. On top of this, repeated doses are on the same chart as single doses. Here some IVs appear to have been modelled as infusions, i.e. injections given slowly over hours. Others simulations at lower doses seem to be rapid injections.
Additionally, the axes on the graphs are not directly comparable. For example, they represent times for the measurements in hundreds of minutes, from 0 to 1600. On the other hand, the times for the simulation are in hours, 0 to 25 or 0 to 12.
The simulation graph is not as crowded as their actual data presentation, but it’s not ideal for clarity.

The Simulation Output
No Direct Comparison?
It is unusual for scientists to overlay all their data as it can make it difficult to see what is happening. But there is something more disturbing. It is challenging to check how successful the modelling was. The NIH did not present or facilitate a direct comparison of their model and the actual data.
There is no diagram comparing the model’s output to the measured data. Such a diagram would help the reader understand how good the fit was. Also, it would be standard practice to give goodness of fit statistics. These provide a statistical estimate of how good the model is.
Here we are only concerned with the oral doses. The IV simulation is relatively trivial. You could start with the dose (instantaneous or extended) and subtract a decay curve (excretion). You can include other minor factors such as going in and out of the tissues. However, the controversy concerns oral doses.
If we look carefully at the measurement data in the first graph of measurements, we find that the curve has fallen back to baseline after 600-800 minutes. That’s 10 to 13 hours. Just a quick look will suffice for now. Then we look at the simulation graph, which shows a similar decline to the baseline. But now, the decay takes about 24 hours. Something is wrong here.
To help out, I have redrawn the curves for 1250mg (1.25g) on the same graph so we can see what is going on. Also, to help remove some confusion, I have placed them on the same scale axes. The simulation is the dashed line, and the measurements are the black disks, as before. Take a look.
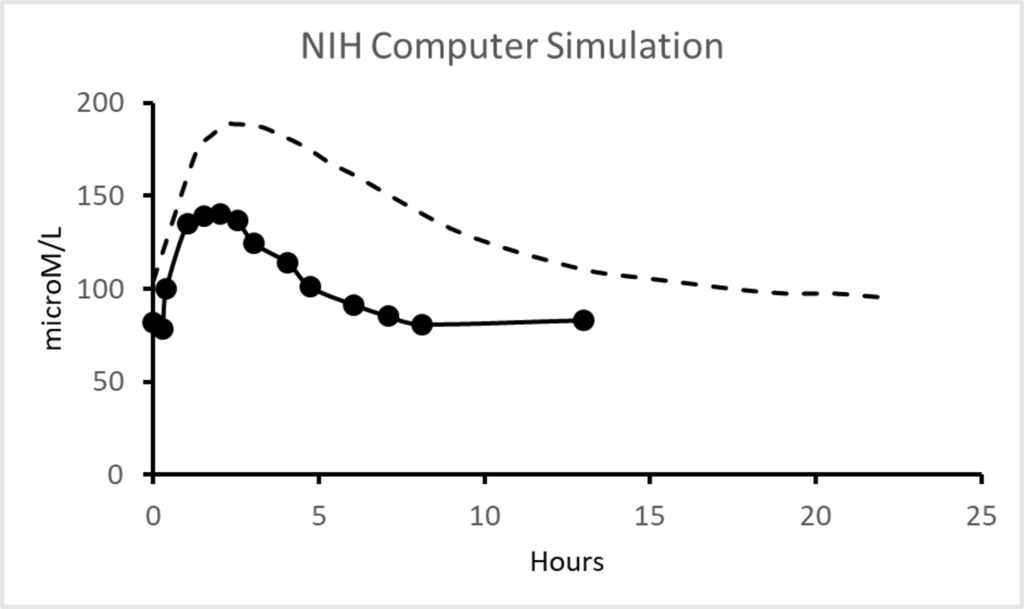
A more sensible comparison
The simulation does not fit the data! The only similarity is that both are slug shaped. The simulation’s slug is considerably taller, say 60 microM taller. That’s an error of over 35%. The length of the simulation slug is about 2x that of the actual data, a 100% error.
Of course, I am just eyeballing these graphs and giving an approximation. We could have done a goodness-of-fit test. In this case, it is pretty irrelevant. There is no fit at all! A competent scientific model builder would have rewritten their software given this discrepancy. It’s an awful model for something that is a well-defined system.
How did this work get through peer review? I have little confidence in peer review, but surely it should have caught these befuddlements. Oh, but it’s the NIH, and they have the money and power. So the journal publishes. Why is medicine still taking this crap seriously? But, but, it’s the NIH. Why don’t doctors and scientists ask questions about the conclusions? It’s the NIH!
Perhaps we should assume that the same NIH scatterbrained approach to presenting the data explains why they did not notice their model was inadequate. Maybe they did not realise that it is conventional to test the fit statistically. Perhaps they didn’t see the need to present the data for direct visual comparison. Decide for yourself. But if you believe the NIH and low doses, I am tempted to offer to sell you a bridge, as the saying goes.
The NIH Conclusions
The NIH concluded that oral intakes of vitamin C could not benefit cancer patients. “Only intravenous administration of vitamin C produces high plasma and urine concentrations that might have antitumor activity.” However, as far as I can tell, their measurement data was from young adults in good health, and theirs is a political statement divorced from the data in their study.
They made further wild extrapolations. “Patient data are not available to confirm pharmacokinetic modeling at high doses and in patients with cancer.” These are misleading weasel words. There was no patient data at all. Furthermore, their measurements did not confirm the accuracy of their modelling. Indeed their data did not confirm their pharmacokinetic modelling at any dose range. To be clear, the model did not fit the data at all. Importantly, all the subjects were in good health and not reported to have cancer. Also, after Cathcart, it is a generally accepted finding that sick people absorb more vitamin C. So this NIH study has no direct relevance to cancer.
More Sensible Conclusions
The NIH simulation may be exceedingly poor, but it does illustrate something important. The NIH recognise that repeating doses gives sustained high blood levels. Look at the first simulation graph and notice that repeated oral doses maintain blood levels above 200 microM. The actual value (~220 microM) is not essential. The value is not reliable as it is from their simulation, which appeared to have an error on the peak level of about a third. Which would mean we would have perhaps 250-300 microM. But this is speculating from crap data.
More important is the NIH agrees with the rest of pharmacological science in realising that repeated doses produce more or less constant blood levels. This stability is critical as sustained concentrations are generally more effective than blips. Doctors know the need to prolong antibiotic treatment of chronic infection. Others may realise that you don’t take all your birth control pills on the first day of the month.
Worshipping at the NIH altar
Perhaps this section should be entitled don’t bite the hand that feeds you. In many cases, doctors will accept any nonsense from the leading funding agencies. The classic if an overused quote is from Upton Sinclair, “It is difficult to get a man to understand something, when his salary depends on his not understanding it.”
Let’s not be naive. If you are not getting gravy now, you might benefit in the future. Moreover, if you attack a leading source of research funding, don’t expect their help. If you go against corporate medicine, expect to have your career destroyed. (I started to put in a supporting history of science reference here but found it had been “retracted” by the journal. It gave me an ironic laugh.)
I will quote a recent (2020) paper to explain the problem. Jens Lykkesfeldt with Pernille Tveden-Byborg reviewed the pharmacokinetics of vitamin C and supported the NIH to the hilt. They stated that the NIH “performed a series of meticulous pharmacokinetic studies in healthy young men and women showing that plasma saturation occurs at a concentration around 70–80 microM.” Meticulous? Really?
Look again at the NIH graphs, particularly the two top curves for repeated doses. The levels are 200+ microM. Perhaps he should ask someone if 200 is a higher number than 70 or even 80?
Is Lykkesfeldt giving his considered response or brownnosing the NIH to use a well-known term? The people reading the earlier posts in this series can come to their own conclusions. However, the supplemented measurements in these papers were at or above the 70-80 microM level. This amount is a baseline, not a maximum “saturation” level. It becomes a little tiresome to explain this to “experts” repeatedly. For over a decade, I have asked for justification for their low-dose and IV ideas. So far, I have received blank, uncomprehending looks and no sensible response. Non! Nada! Niet!
Even the NIH squirmed at the question. So they changed “saturated” at 70-80 microM to “tightly controlled” at 220 microM in more recent publications. More misleading waffle, of course. (Because of my criticism, I was asked only to communicate with the NIH through the Office of the Director. Strange people.) But here we have others like Lykkesfeldt reading the original paper and repeating the nonsense.
Lykkensfeldt then demolishes his own argument by admitting it’s “possible to exceed the homeostatic saturation level of 70–80 µM by several fold through multiple daily gram doses of vitC.” So, adding “a dose of 2 g of vitC given three times a day is likely to result in a steady state plasma concentration of about 250 microM.” So he admits that dynamic flow (taking repeated large doses) makes his and the NIH “saturated” statement moot.
To further show his confusion, Lykkensfeldt states, “The fact that overshooting the homeostatic point of saturation around 70 μmol/L [i.e. microM] in plasma only produces a very short-lived increase in body vitamin C has been mostly ignored in the clinical literature.” But, repeating, he just said three doses of 2g can maintain a steady state at 250 microM. A steady state means the opposite of short-lived. Duh. So it can only generate a short-lived increase but a steady 250 microM with repeated doses—quite a contradiction.
He then claims “the possible health benefits from such supraphysiological levels have yet to be documented”. Those documents were by renowned Doctors Linus Pauling, Fred Klenner, Robert Cathcart, Hugh Riordan, Albert Szent Gyorgi, Archie Kalokerinos, Abram Hoffer, and old Uncle Tom Cobley and all. I have also documented these high-dose claims explicitly in terms of pharmacokinetics and blood levels, starting with Dr Hilary Roberts in the book Ascorbate. Selection of data and ignoring the historical literature is a common trick, as shown here.
The selective treatment continues. Lykkensfeldt suggests that liposomal vitamin C is an “approach to increase the maximum achievable plasma concentration through oral administration.” I can confirm this is true as I published the first paper on the topic. We found that you could obtain levels with liposomes around 400 microM. This level, however, was an underestimate. The results are sensitive to the type and nature of the liposomes used and how the concentration is measured. Later reports provided by independent researchers suggest sustained levels of 600-700 microM are achievable.
I provide this graph to indicate what a single gram (1000mg) of well-formulated commercial liposomes might achieve.
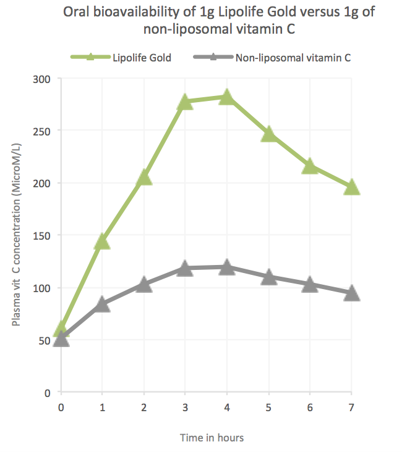
Data courtesy of Lipolife
Notice here the single gram of liposomal vitamin C gives plasma levels approaching 300 microM. This level is above the maxima reported by the NIH etc. So how do they explain this away? Easy. Lykkesfeldt selects a single experiment with a plasma level of only 200 microM from four grams of liposomal vitamin C. These low values might result from poor measurement techniques or suboptimal liposome manufacture. Quality liposomes are challenging to obtain.
Lykkesfeldt suggests that high-dose clinical trials of high-dose vitamin C supplements are a waste of time. This statement comes from his self-refuted claim that only a short-lived increase above the baseline blood level will occur. Lykkesfeldt gave no other explanation. By this argument, drinking water when thirsty is just a waste of time because it will be excreted, an absurdity.
Let’s drive the point home. A healthy individual has a glucose level in the blood that is homeostatically controlled and returns to baseline after eating sugar or starch. By Lykkenfeldt’s argument, there should be no studies on drugs or foods where the blood level to baseline (zero). That is, take his claim seriously, and there should essentially be no drug studies at all. As is probably evident at this point, it is difficult to explain things to the “experts” a young child would understand.
Lykkenfeldt made no reference to Linus Pauling in a paper that claimed to address two questions. “What is the optimal intake of vitamin C?” and “What is the preventive and therapeutic potential of vitamin C?” How is it acceptable to ignore nutrition’s prevailing popular paradigm? Of course, I could say there was also no reference to Robert Cathcart, bowel tolerance, or the objections to the failed NIH ideas he is repeating. But what’s the point? Why should insiders on the gravy train care about truth?
There is no excuse for “experts” supporting low doses and not indicating that there is another viewpoint. Rentiers do it for funding. The ironic thing is that the funding they receive is driven by finding answers to Linus Pauling and the other unmentionables.

Carlo Cipolla’s stupidity matrix